Data from the 2012 USC AQMD (Air Quality Management District) survey was visualized for an Information Visualization course. The project was completed in collaboration with Mark Vrahas, Shaina Wooley and Kieran Reynolds.
USC AQMD
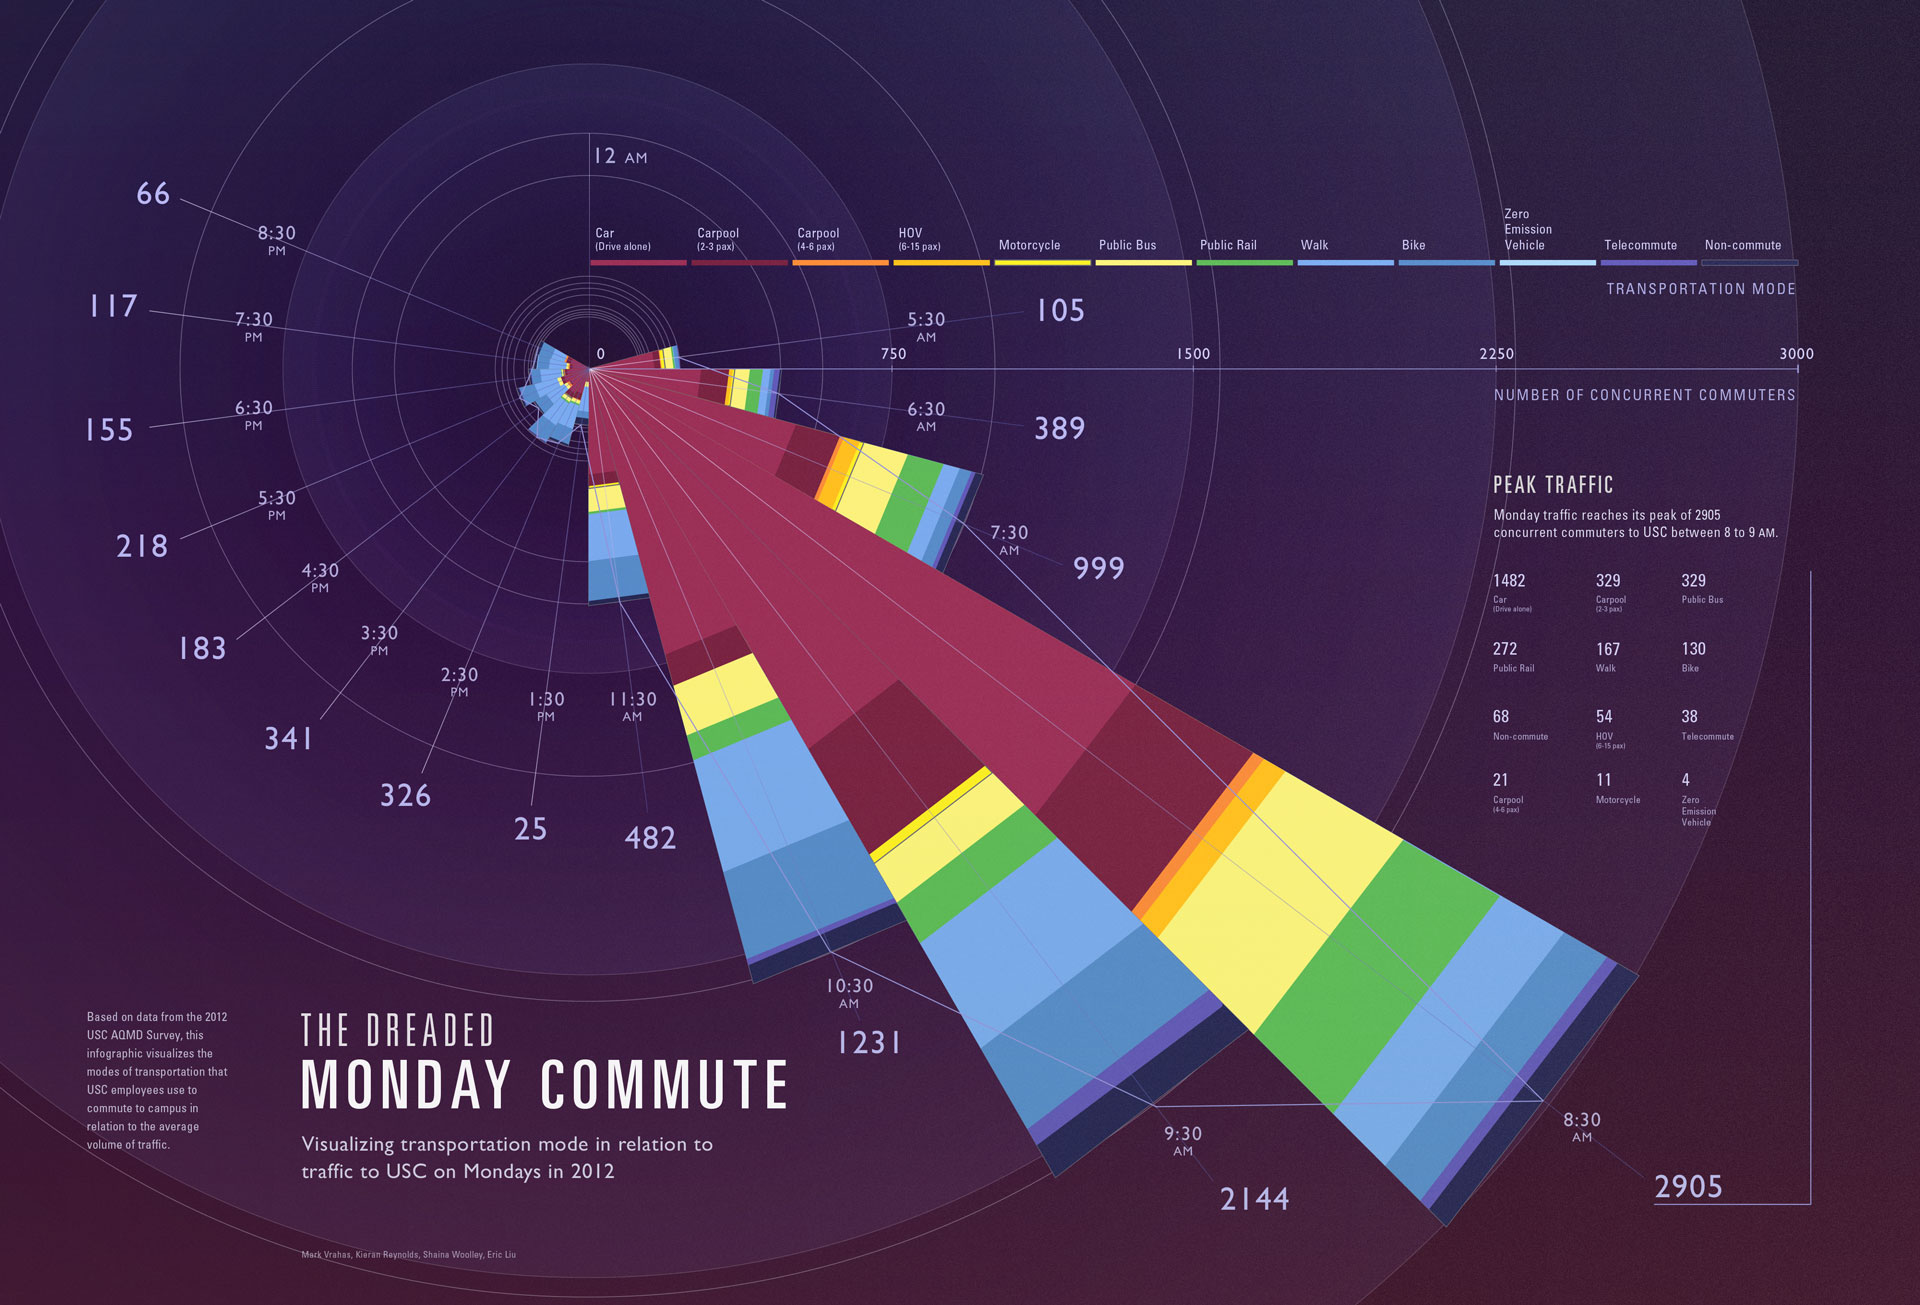
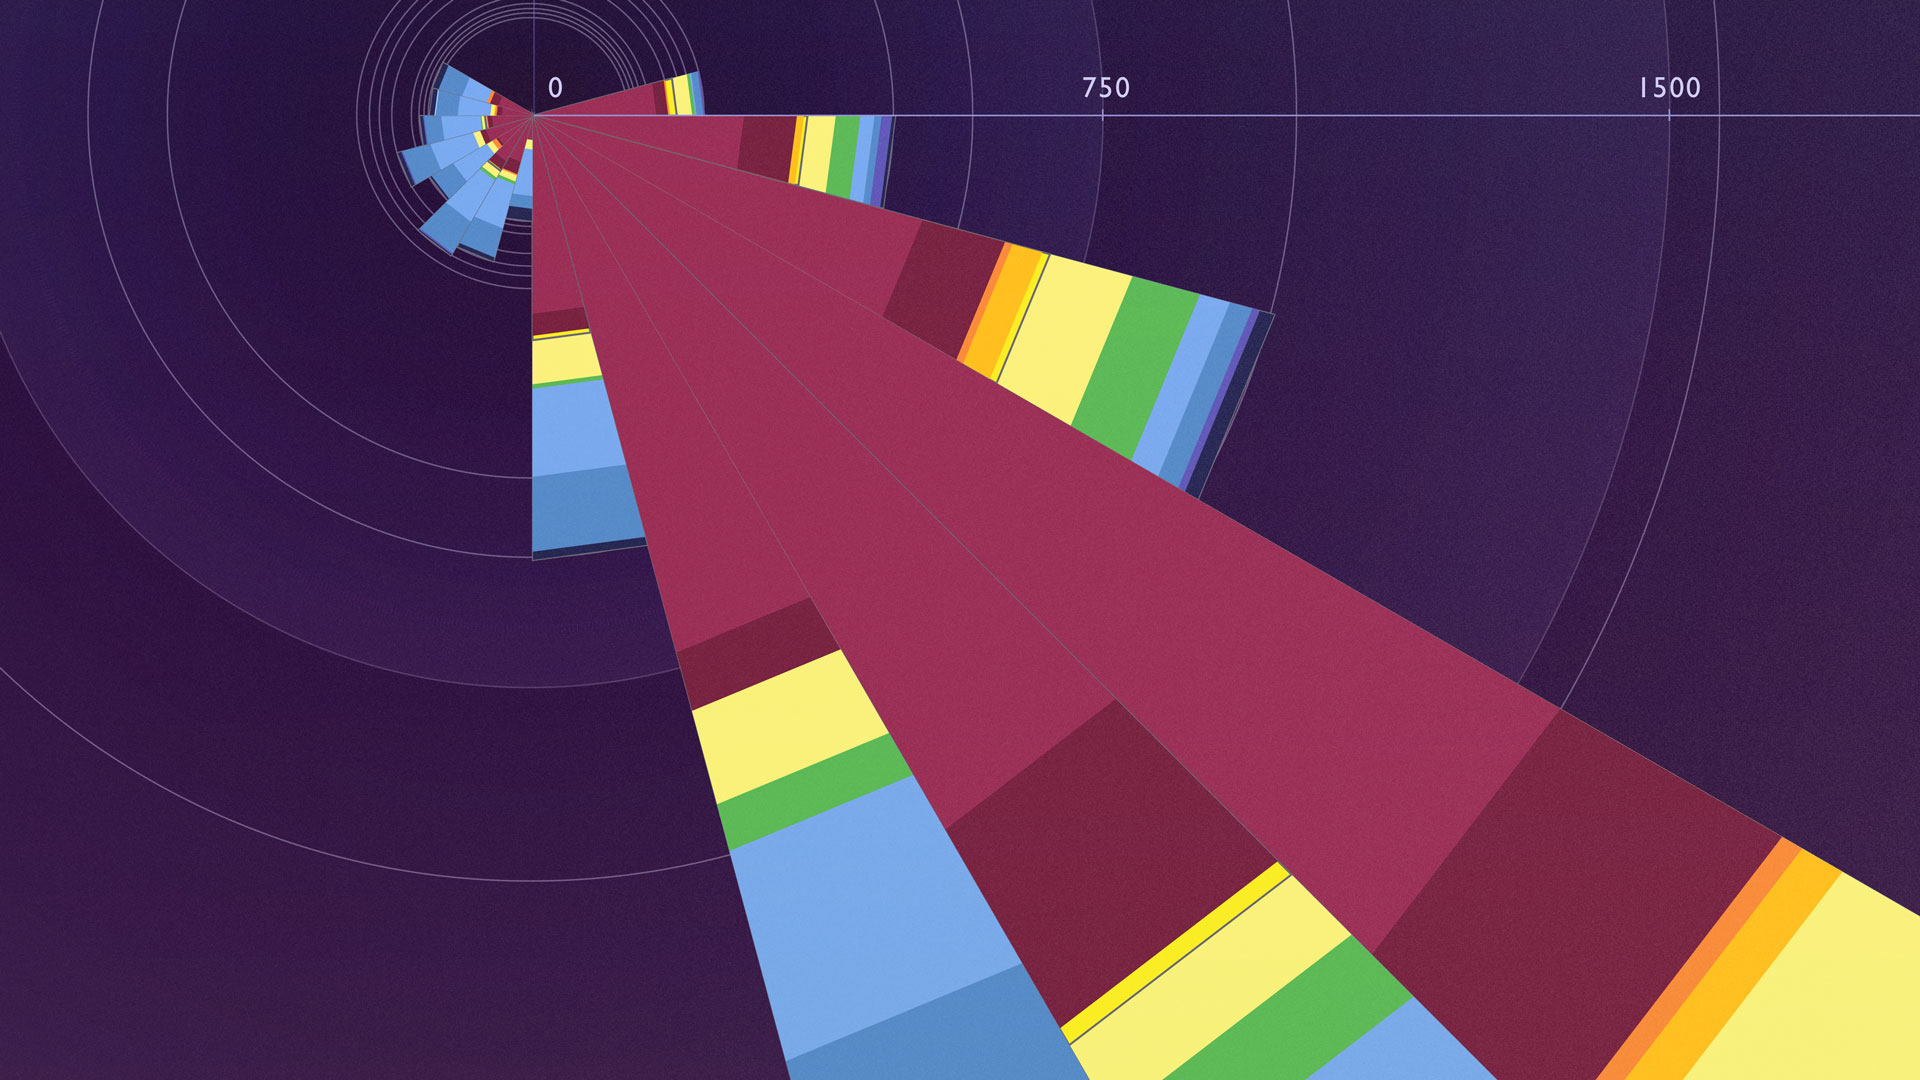
Automotive transportation increases drastically during peak hours in relation to volume of concurrent traffic. The distortion caused by radial charts is used to make the portion of automotive commuters appear disproportionately large.